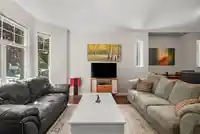
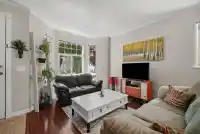
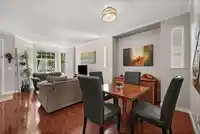
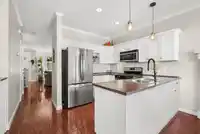
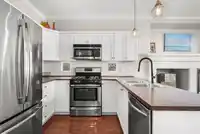
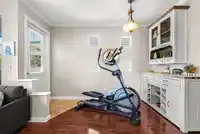
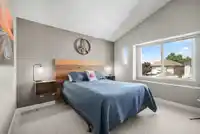
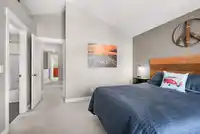
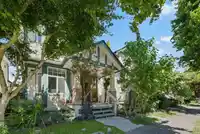
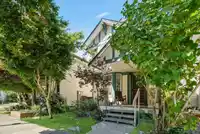
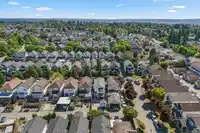
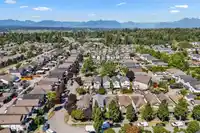
WELL-KEPT Clovervalley Station home in Quiet, hidden neighborhood! Offering 4Bdrm/3bth PLUS 1Bdrm unauth self-contained Bsmt suite w/Sep entry & own laundry. Updated laminate throughout living/dining area into kitchen/family room. Bright kitchen offers SS appliances, double sinks, lots of windows + family room w/gas fireplace & built-ins that can be used as…
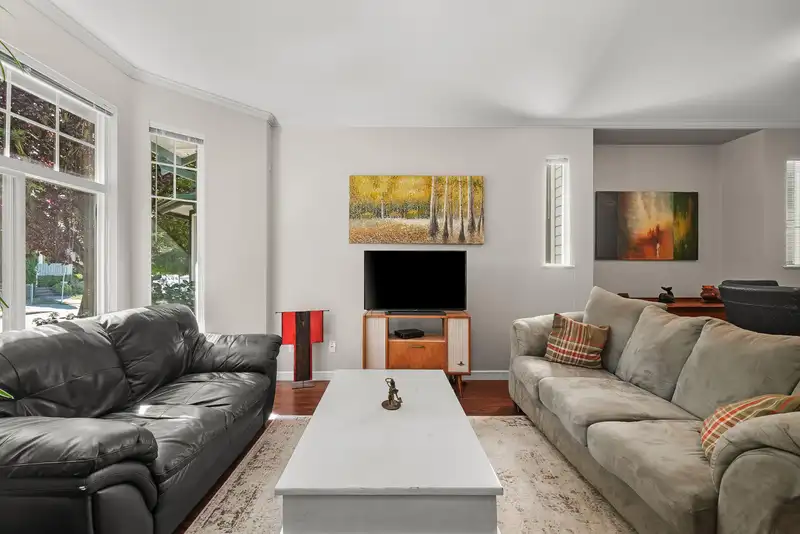
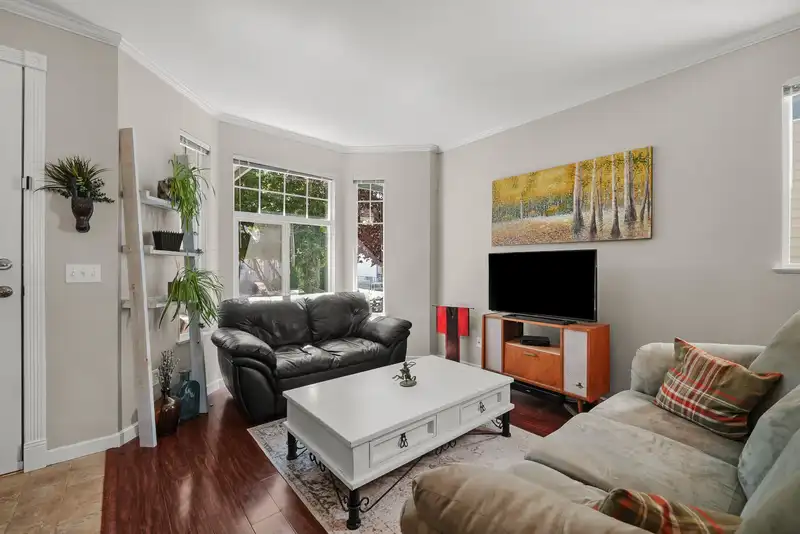
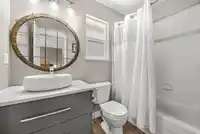
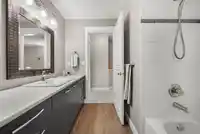
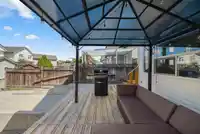
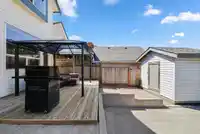
WELL-KEPT Clovervalley Station home in Quiet, hidden neighborhood! Offering 4Bdrm/3bth PLUS 1Bdrm unauth self-contained Bsmt suite w/Sep entry & own laundry. Updated laminate throughout living/dining area into kitchen/family room. Bright kitchen offers SS appliances, double sinks, lots of windows + family room w/gas fireplace & built-ins that can be used as bar/coffee station. Upstairs the Primary offers 3pc ensuite & walk-in closet + 2 generous sized bdrms. Updated vinyl plank flooring in upstairs bths + newer countertops & cabinets. Step out onto your covered patio constructed w/free-floating deck panels. Roof is approx 2yrs new. Come see this house for yourself!
Features
Storage
Open
Other
Front Access
Lane Access
Shopping Nearby
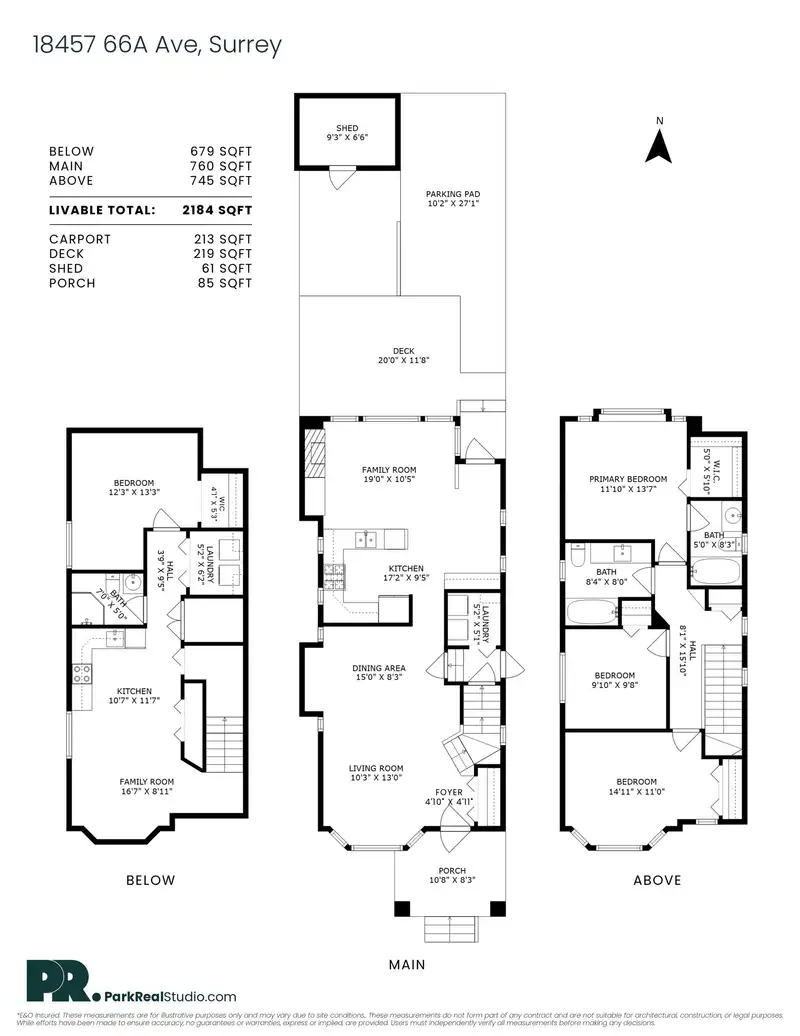
Room measurements15 rooms▸
FoyerMain · 4'10 × 4'11
Living RoomMain · 13'0 × 14'8
Dining RoomMain · 8'3 × 15'0
KitchenMain · 9'5 × 17'2
Family RoomMain · 10'5 × 19'0
Primary BedroomAbove · 13'7 × 11'10
Walk-In ClosetAbove · 5'10 × 5'0
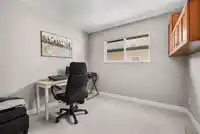
BedroomAbove · 9'8 × 9'10
BedroomAbove · 11'0 × 14'11
Family RoomBelow · 8'11 × 16'7
KitchenBelow · 11'7 × 10'7
BedroomBelow · 13'3 × 12'3
Walk-In ClosetBelow · 5'3 × 4'1
LaundryBelow · 6'2 × 5'2
UtilityBelow · 4'3 × 5'8
Floor plan
🔍 Tap to zoom
Pinch or scroll to zoom · drag to pan · double-tap to reset
Zoning, lot dimensions and grade are approximate, from public data, and for reference only — verify with the City / Township of Langley before relying on them.
Recent nearby sales
Sold prices are available to registered users. Log in to see what these sold for.

 1 / 26 photos