
 1 / 39 photos

















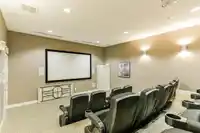

About This Property
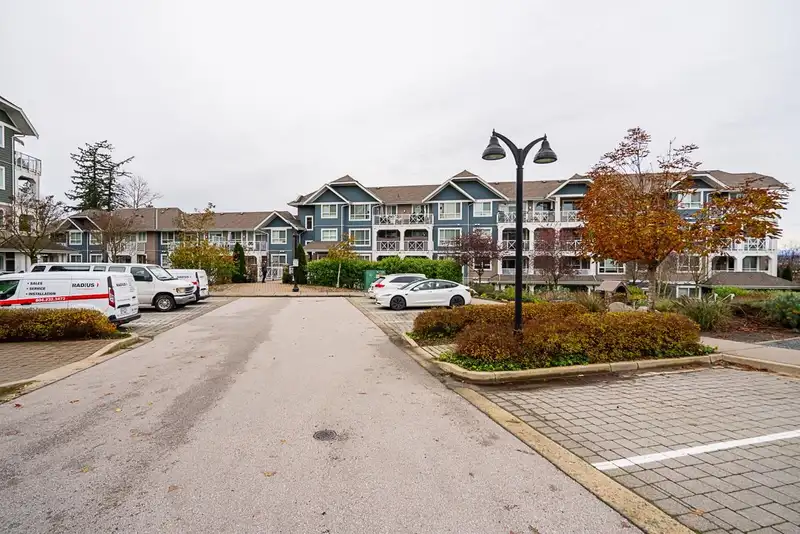
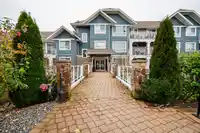
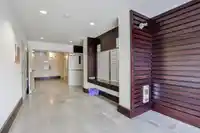
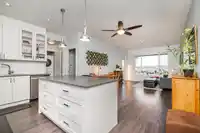
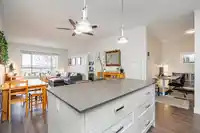
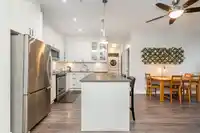
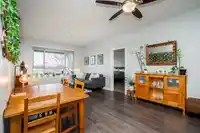
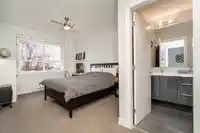
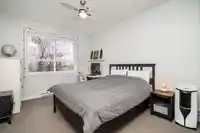
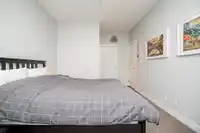
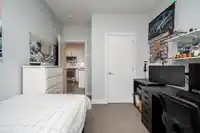
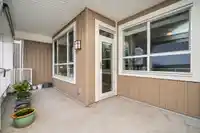
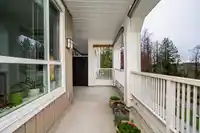
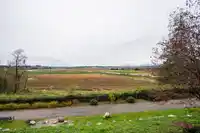
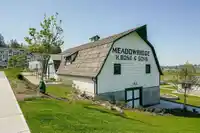
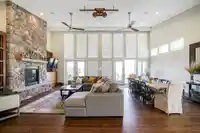
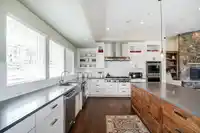
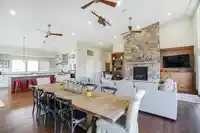
The Ridge at Bose Farms! Large 990 sq ft, 2 bedroom + DEN with awesome farmland views to the west! Great layout with bedrooms on opposite sides plus a bonus den area for your home office or ? Oversized windows, high end white kitchen w/quartz counters, S/S appliances and kitchen island with eating bar. 2 underground secured parking spots + storage locker.…
Features
Property Details
School Catchment
Neighbourhood
Age
- Under 1521.1%
- 15 to 6468.9%
- 65 and over9.9%
Household size
- 1 person14.3%
- 222.9%
- 318.1%
- 424%
- 5 or more20.6%
Language spoken at home
65.6% English mother tongue
Mother tongue, share of 7,845 residents.
How this pocket differs
- fewer seniors 65+ than Cloverdale BC 9.9% vs 14.6%
- fewer people living alone than Cloverdale BC 14.3% vs 17.9%
- more 5+ person households than Cloverdale BC 20.6% vs 16.9%
- Median household income is notably higher than Metro Vancouver $137,000 vs $90,000
Source: Statistics Canada, Census of Population, 2021. Reproduced and distributed on an "as is" basis with the permission of Statistics Canada.
Recent nearby sales
Sold prices are available to registered users. Log in to see what these sold for.
Monthly Cost Calculator
An estimate only. Canadian semi-annual compounding; excludes utilities, closing costs and BC property transfer tax. 5-year fixed, as of Oct 15
Similar Listings Nearby
309 16380 64 AVENUE
103 16488 64TH AVENUE
202 16398 64 AVENUE
205 16455 64 AVENUE
204 16469 64 AVENUE
201 16499 64 AVENUE
220 10838 WHALLEY BOULEVARD
304 16068 83 AVENUE
202 16068 83 AVENUE
212 16085 83 AVENUE
307 5906 176A STREET
105 16137 83 AVENUE