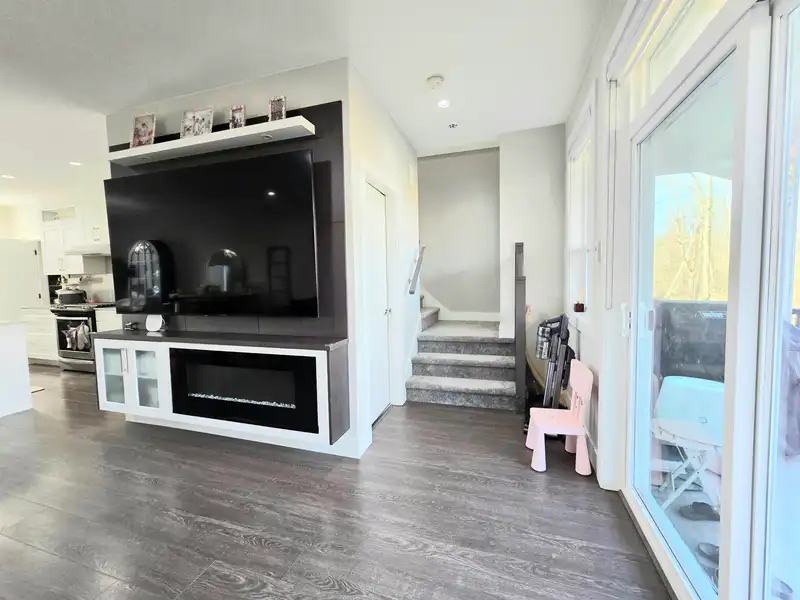
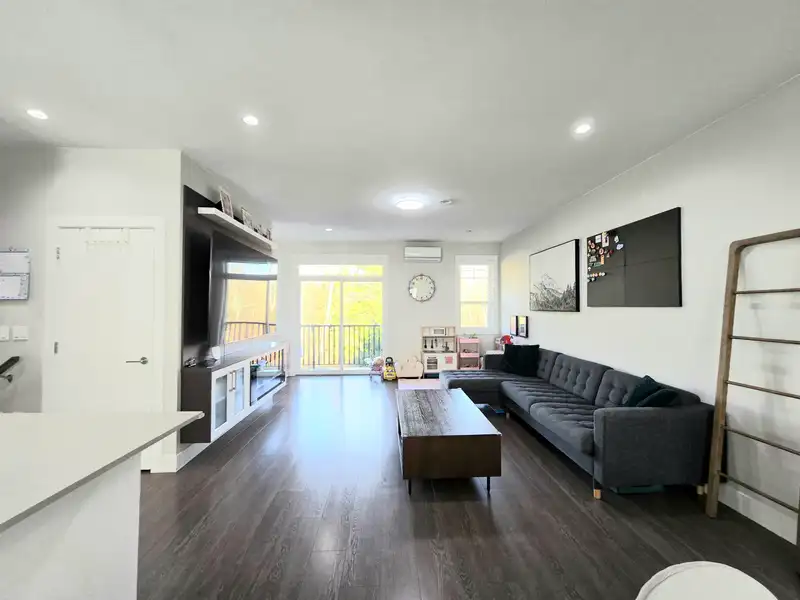
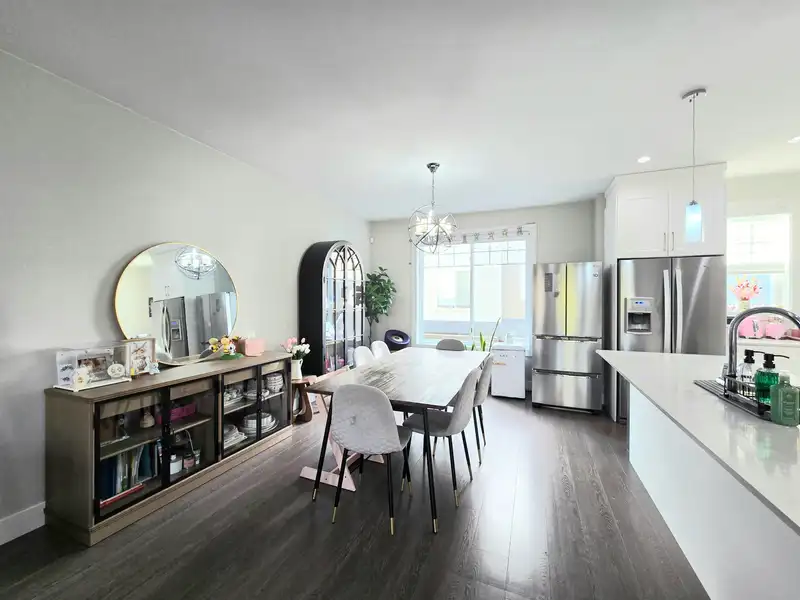
Welcome to ONYX, a premium end-unit townhome in the heart of Clayton Heights. This spacious 4-bed, 4-bath home offers 1849 sq ft of thoughtfully designed living space and backs onto a lush greenbelt, providing exceptional privacy and a serene setting. The gourmet kitchen features quartz countertops, a ceramic tile backsplash, stainless steel appliances, a…
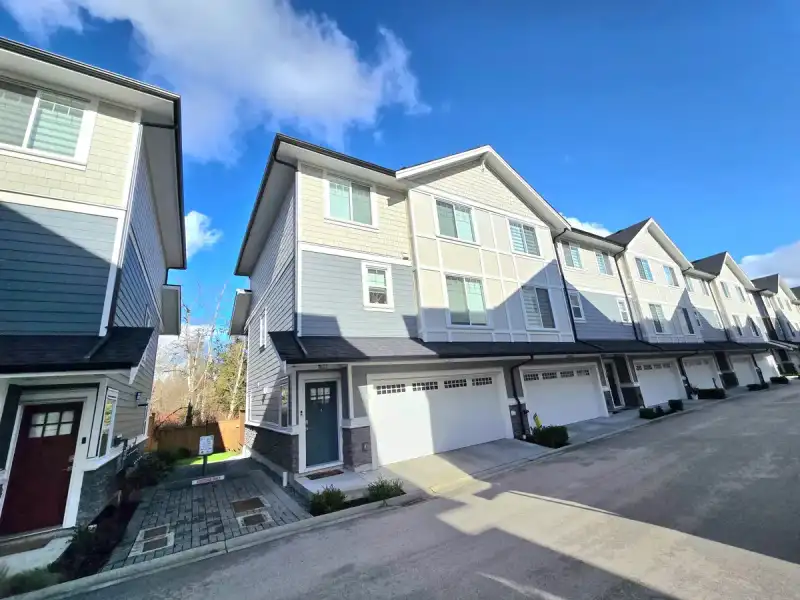
Welcome to ONYX, a premium end-unit townhome in the heart of Clayton Heights. This spacious 4-bed, 4-bath home offers 1849 sq ft of thoughtfully designed living space and backs onto a lush greenbelt, providing exceptional privacy and a serene setting. The gourmet kitchen features quartz countertops, a ceramic tile backsplash, stainless steel appliances, a gas stove, and a large island perfect for entertaining. Step onto your private balcony complete with a BBQ hookup for effortless outdoor living. Comfort is key with air conditioning and radiant floor heating. Include full-size laundry and a double garage for ample storage and convenience. Ideally located just minutes from Costco, Walmart, Willowbrook Mall, parks, and everything you need is right at your foot step. A Pleasure to show!
Features
Balcony
Private Yard
Garage Double
Front Access
Concrete
Shopping Nearby
Room measurements11 rooms▸
Living RoomMain · 16' × 18'9
Dining RoomMain · 9'4 × 15'10
KitchenMain · 9'8 × 15'10
PantryMain · 3'6 × 7'7
Primary BedroomAbove · 10'9 × 15'
Walk-In ClosetAbove · 5' × 7'9
BedroomAbove · 11'5 × 12'11
BedroomAbove · 8'10 × 11'10
BedroomBelow · 10'5 × 13'7
DenBelow · 4'11 × 5'2
FoyerBelow · 2'3 × 3'5
Floor plan
🔍 Tap to zoom
Pinch or scroll to zoom · drag to pan · double-tap to reset

 1 / 27 photos