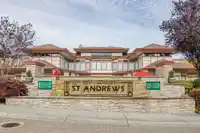
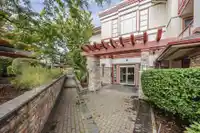
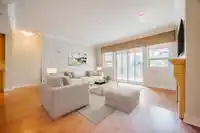
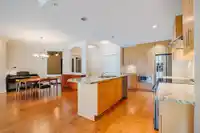
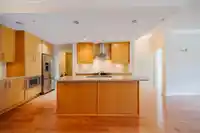
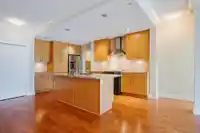
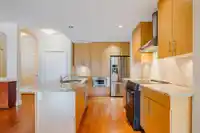
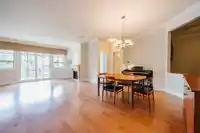
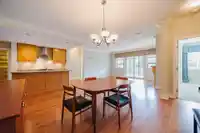
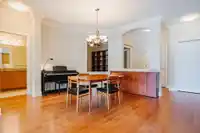
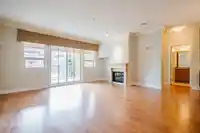
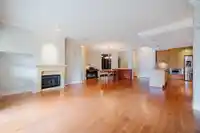
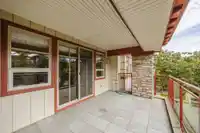
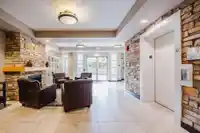
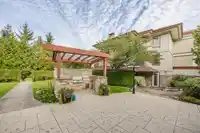
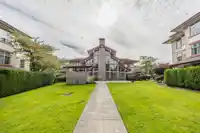
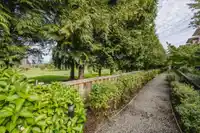
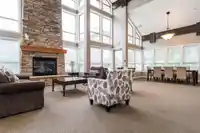
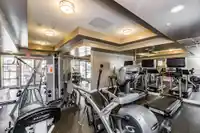
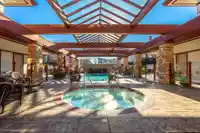
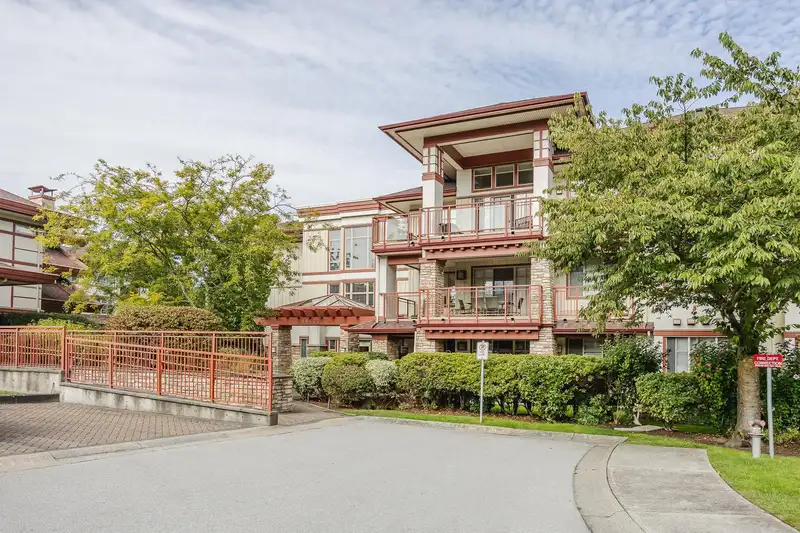
Welcome to the sought after GATED COMMUNITY of St. Andrews in Cloverdale. This adult oriented lifestyle represents a blend of elegance, comfort, and prime location with Northview golf course as your backyard. This 2 bed/2bath w/ den boasts over 1300sq ft and open floor plan.The state-of-the-art kitchen is a chef’s delight, featuring top-of-the-line S/S…
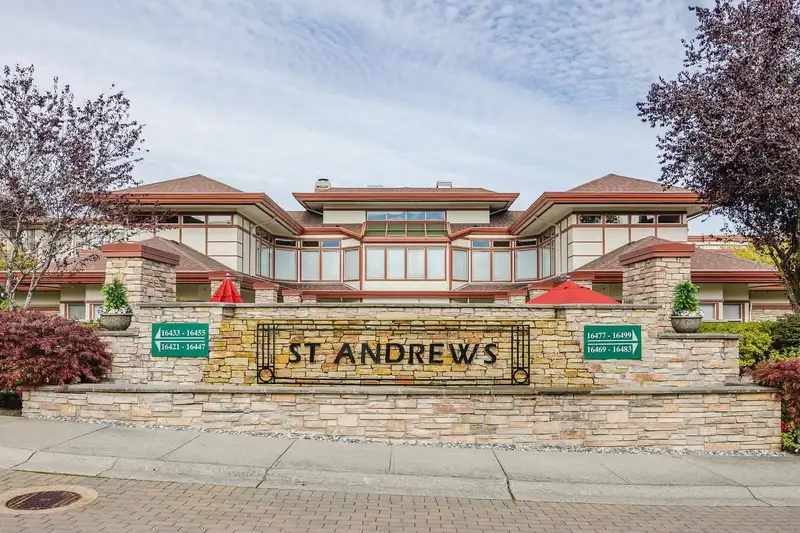
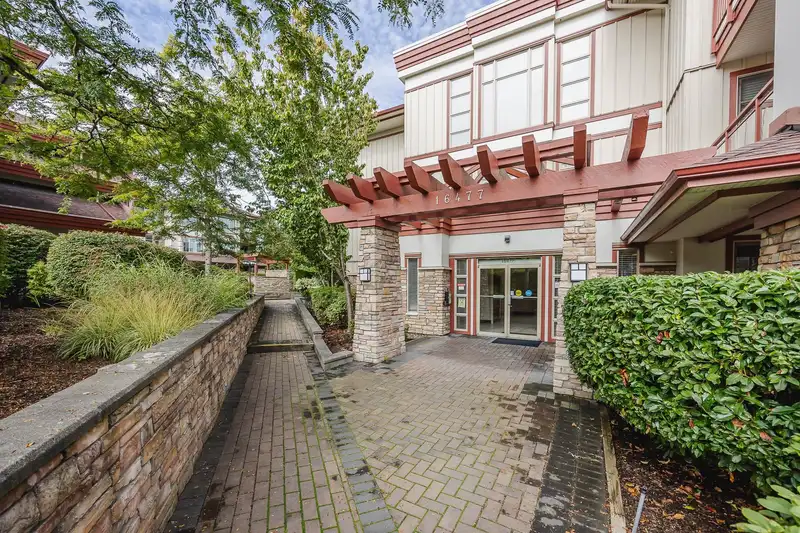
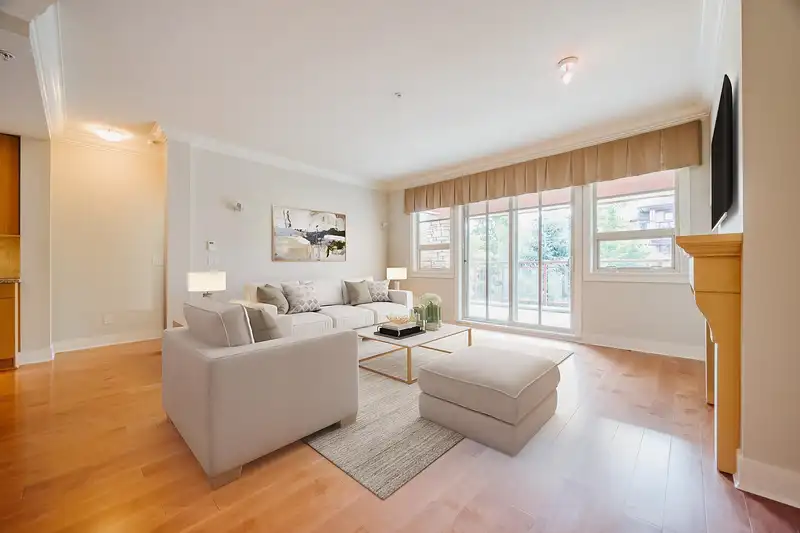
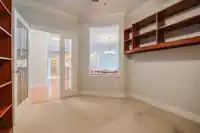
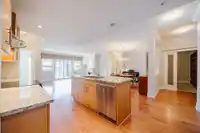
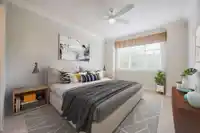
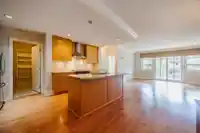
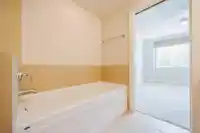
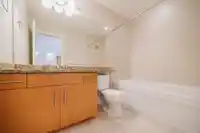
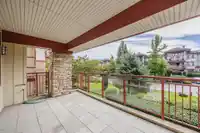
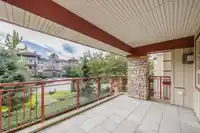
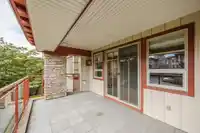
Welcome to the sought after GATED COMMUNITY of St. Andrews in Cloverdale. This adult oriented lifestyle represents a blend of elegance, comfort, and prime location with Northview golf course as your backyard. This 2 bed/2bath w/ den boasts over 1300sq ft and open floor plan.The state-of-the-art kitchen is a chef’s delight, featuring top-of-the-line S/S appliances, Bosch Gas Range, granite countertops and large center island for entertaining. Located in the Quiet side of the complex to enjoy morning coffee. The resort style amenities include a fitness center, heated outdoor pool/ho ttub, sauna/steam room and stylish lounge area, all designed for relaxation and recreation. This home is perfect for those seeking a sophisticated lifestyle! Call now!
Features
Elevator
Guest Suite
Storage
Pantry
Balcony
Underground
Guest
Garage Door Opener
Adult Oriented
Gated
Shopping Nearby
Room measurements9 rooms▸
KitchenMain · 15'9 × 9'0
Dining RoomMain · 10'5 × 9'9
Living RoomMain · 12'5 × 15'10
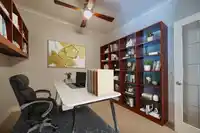
DenMain · 10'3 × 10'7
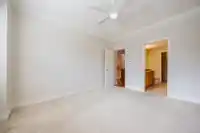
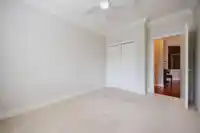
Primary BedroomMain · 14'2 × 11'7
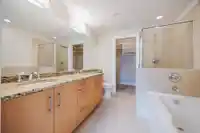
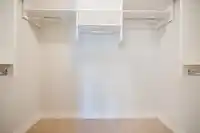
Walk-In ClosetMain · 4'9 × 8'1
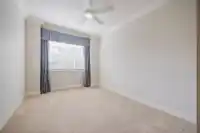
BedroomMain · 12'10 × 9'10
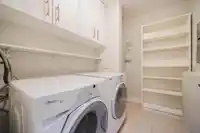
LaundryMain · 6'1 × 8'0
FoyerMain · 5'6 × 6'1
Floor plan
🔍 Tap to zoom
Pinch or scroll to zoom · drag to pan · double-tap to reset

 1 / 40 photos